Interest Rate Analysis
Introduction
Interest rates impact the entire economy. A high mortgage rate might discourage potential homebuyers. A low interest rate on loans improves access to credit for startups looking to scale. More broadly, the interest rate has profound impacts on two fundamental indicators: the unemployment rate and inflation.
The Federal Open Market Committee (FOMC), a branch of the Federal Reserve, meets eight times a year to set a target range for the federal funds rate, the interest rate banks charge each other for reserve balances that aren’t backed by collateral. While this sounds like an odd situation to target, it has ripple effects on every other interest rate, although at varying levels. Most directly, it affects short-term interest rates, such as Treasury bills or the prime rate, the interest banks charge on customers with good credit. However, it can also affect longer term interest rates such as 30 year bonds and mortgages.
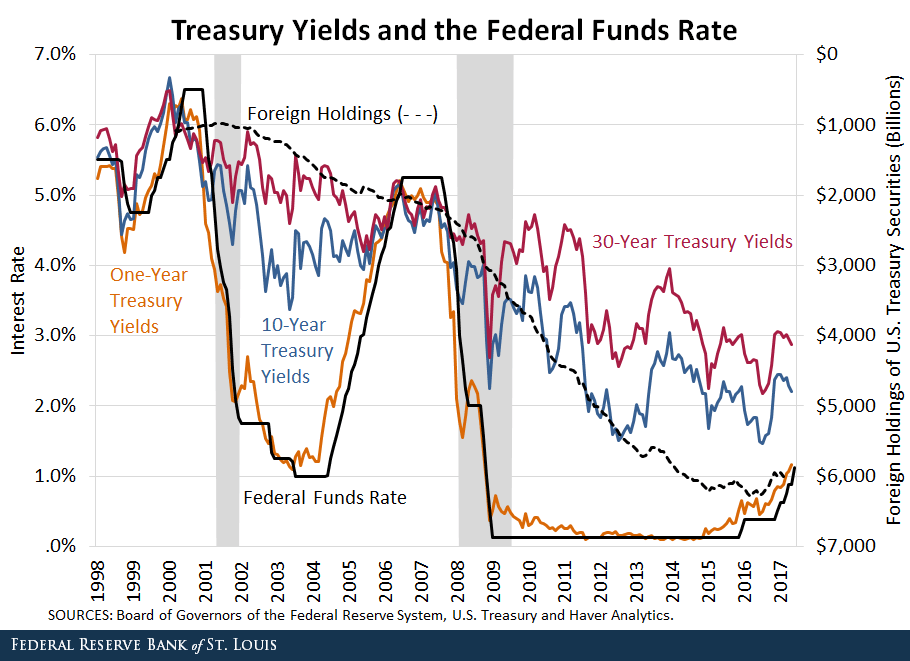
Federal funds rate compared to other securities
The exact range the FOMC, composed of twelve members, sets depends on what the committee views will meet the Fed’s Dual Mandate, which aims to achieve maximum employment and price stability. In the last three meetings, held in September, November, and December of this year, the committee chose to keep the target rate unchanged at \(5.25-5.50\%\), the highest rate in 22 years.
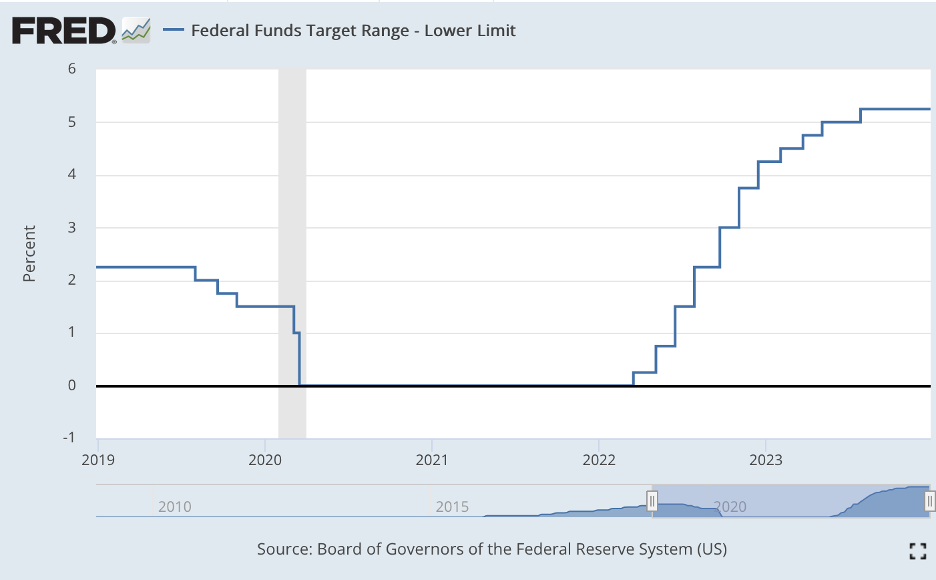
Lower limit of the federal funds rate, 2019 – Present
How can we predict what the FOMC will set before it actually announces its decision? Knowing ahead of time what the interest rate will be has enormous importance: it can influence investment decisions, the stock market, and consumer behavior. Besides looking at the size of a briefcase, there are some tools available to us. The most popular is the CME FedWatch, which provides probabilities for each target range. Another relatively new method is utilizing online prediction markets, such as Kalshi, founded in 2018. But which one is more accurate?
How FedWatch Works
The CME Fedwatch Tool, launched in 2013 by the CME Group, a financial services company which largely deals in the derivatives market, provides probabilities daily for each upcoming meeting and their potential target ranges. For instance, at the time of writing this article, there is a roughly \(81.4\%\) chance that in the January 2024 meeting the Fed will keep interest rates unchanged, and a \(18.6\%\) chance that they will cut rates by 25 bps (basis points) to \(5.00-5.25\%\).
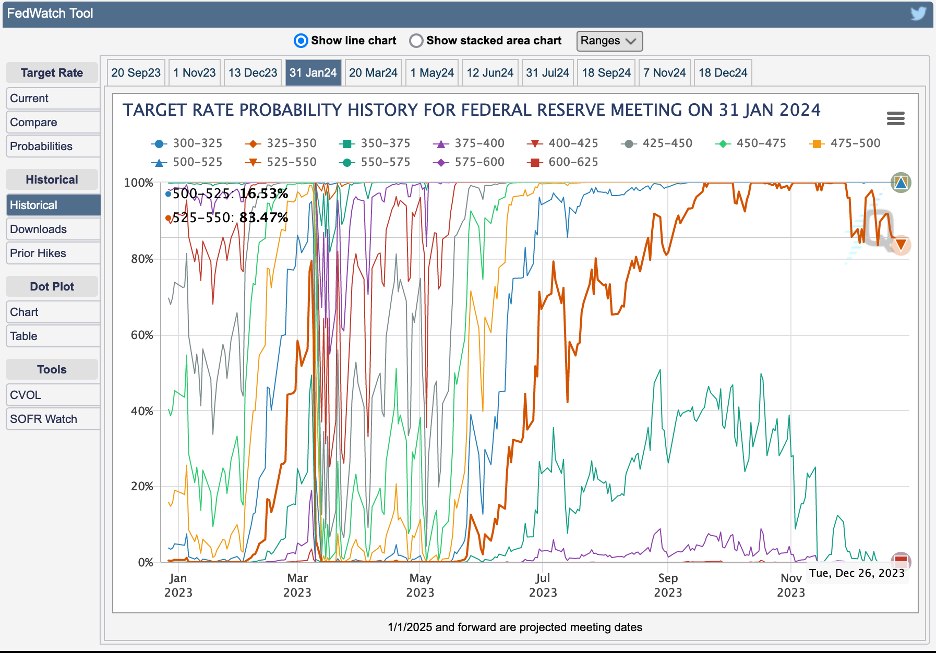
Probability history for the upcoming Jan. 2024 meeting
The probabilities for each range are based on Fed Fund futures, which are traded on the Chicago Mercantile Exchange (CME). For instance, take a look at ZQF24, the 30-day federal funds futures for the January 2024 meeting. To find the estimated effective federal funds rate at a given time, take \(100 - Price\). The current price (as of Dec 27, 2023) is \(94.67\), implying an effective rate of \(5.33\%\), on the lower end of the \(5.25-5.50\%\) range.
The data is not available in real time: quotes are currently delayed by “at least 10 minutes” and beginning in April of next year, “settlement data … will have a delayed publication time of 12:00 a.m. CT”. Want real-time access? That will be $24,000 a year for a distribution license and monthly device fees on top of that.
These futures inform the probabilities that the FedWatch publishes daily, with the regular assumptions such as rate changes being in increments of 25 bps and the effective rate being bounded by zero (this is not so true in other countries).
How Kalshi Works
Kalshi is a financial exchange that offers event contracts. Founded by MIT alumni Tarek Mansour and Luana Lopes Lara, it became the “first federally regulated event-based trading exchange in U.S. history” after receiving a federal license from the Commodities Futures Trading Commission (CFTC) in 2021. Personally, I started using the site a few months after it launched, being a fan of PredictIt previously, but discouraged by the lack of non-political markets. Kalshi, on the other hand, provides a wider array of markets (I’ve traded whether it would rain in Seattle), but does not currently offer political markets, which they are currently litigating.
Event contracts are binary: either the market resolves ‘yes’ or ‘no’, with a $1 denomination per contract. The prices for the market are completely based on the participants of the site, which are majority retail traders. Technically, when people trade, they aren’t directly trading with each other, but with a regulated clearing house, which has a legal obligation to complete the trade as a counterparty, and is fully collateralized. Kalshi makes money with trading fees.
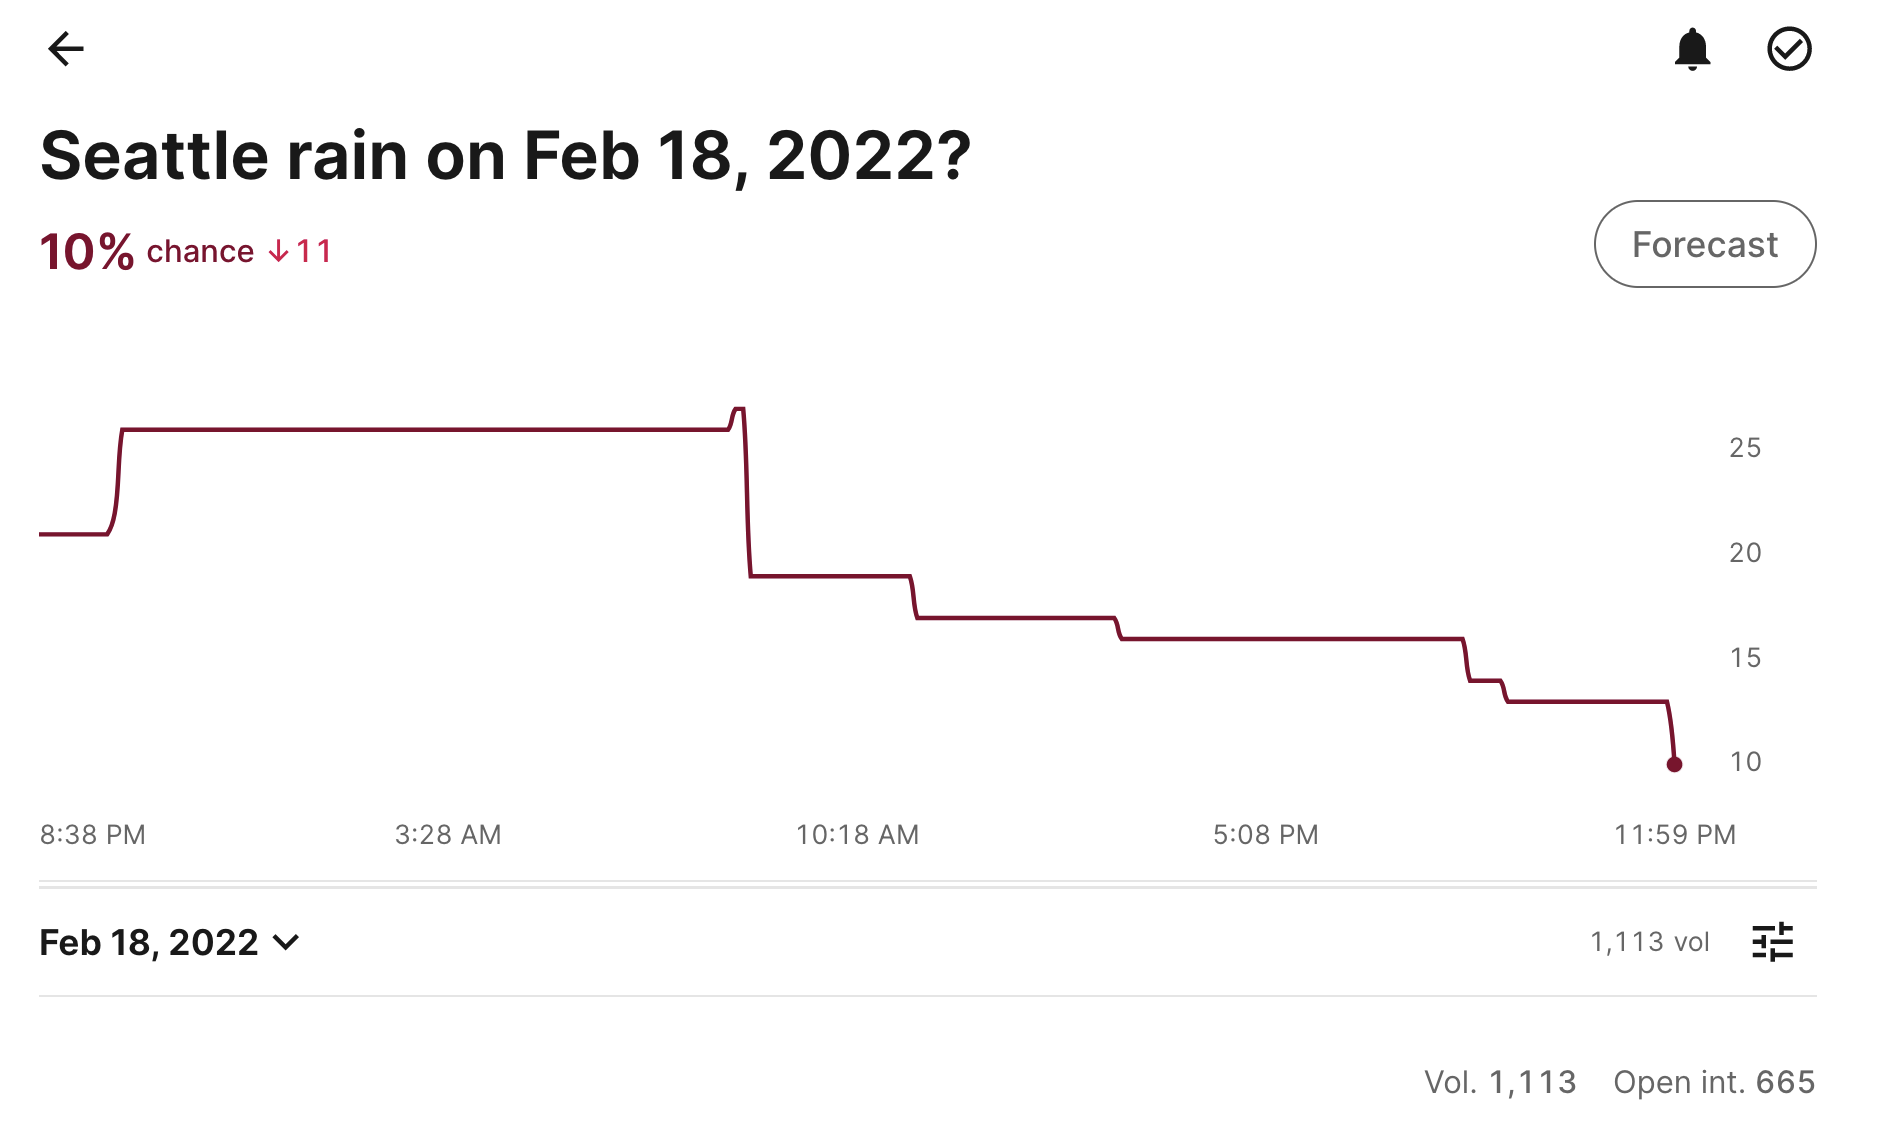
Sample market on kalshi.com
The federal funds market in question is found here. While FedWatch produces probabilities based on ranges, Kalshi operates on a ‘above \(X\%\)’ basis; for example, the ‘above \(5.25\%\)’ contract is currently trading at \(98\) cents, indicating a roughly \(98\%\) probability that the target rate will exceed that value following the January 2024 meeting
Data Collection
To compare the two markets, I extracted the historical prices for three meetings over time: December, November, and September 2023. For Kalshi, I wrote a script in Python using their API. To transform the data for comparison, I used differences between contracts to infer the probability of a target range. For instance, if there is a \(90\%\) chance that the rate is above \(5.25\%\), and \(50\%\) chance the rate is above \(5.50\%\), we can infer a \(40\%\) chance that the rate will be set at \(5.25-5.50\%\).
The CME FedWatch provides CSV downloads for their historical data. Unfortunately, it only goes back to September of this year. While they do have an API, it is paid and requires contacting their team with a business email and phone number.
Analysis
To directly compare Kalshi and FedWatch, I found the implied interest rate by weighting each target range with the probability provided at a given time. For instance, in the FedWatch example earlier, the implied rate (which we will denote IR) for January 2024 based on today’s expectations is calculated as
\[IR = 512.5 \cdot 0.186 + 537.5 \cdot 0.814 = 532.85 \text{ bps } (5.33\%)\]In this calculation, we took the probability (the second number) and multiplied it by the midpoint of the range in basis points (the first number). This is essentially an expected value. For the FedWatch, I was able to calculate implied target rates daily, and for Kalshi as often as people trade, which is 8AM-12AM five days a week and 8AM-10PM two days.
Let’s take a look at the results:


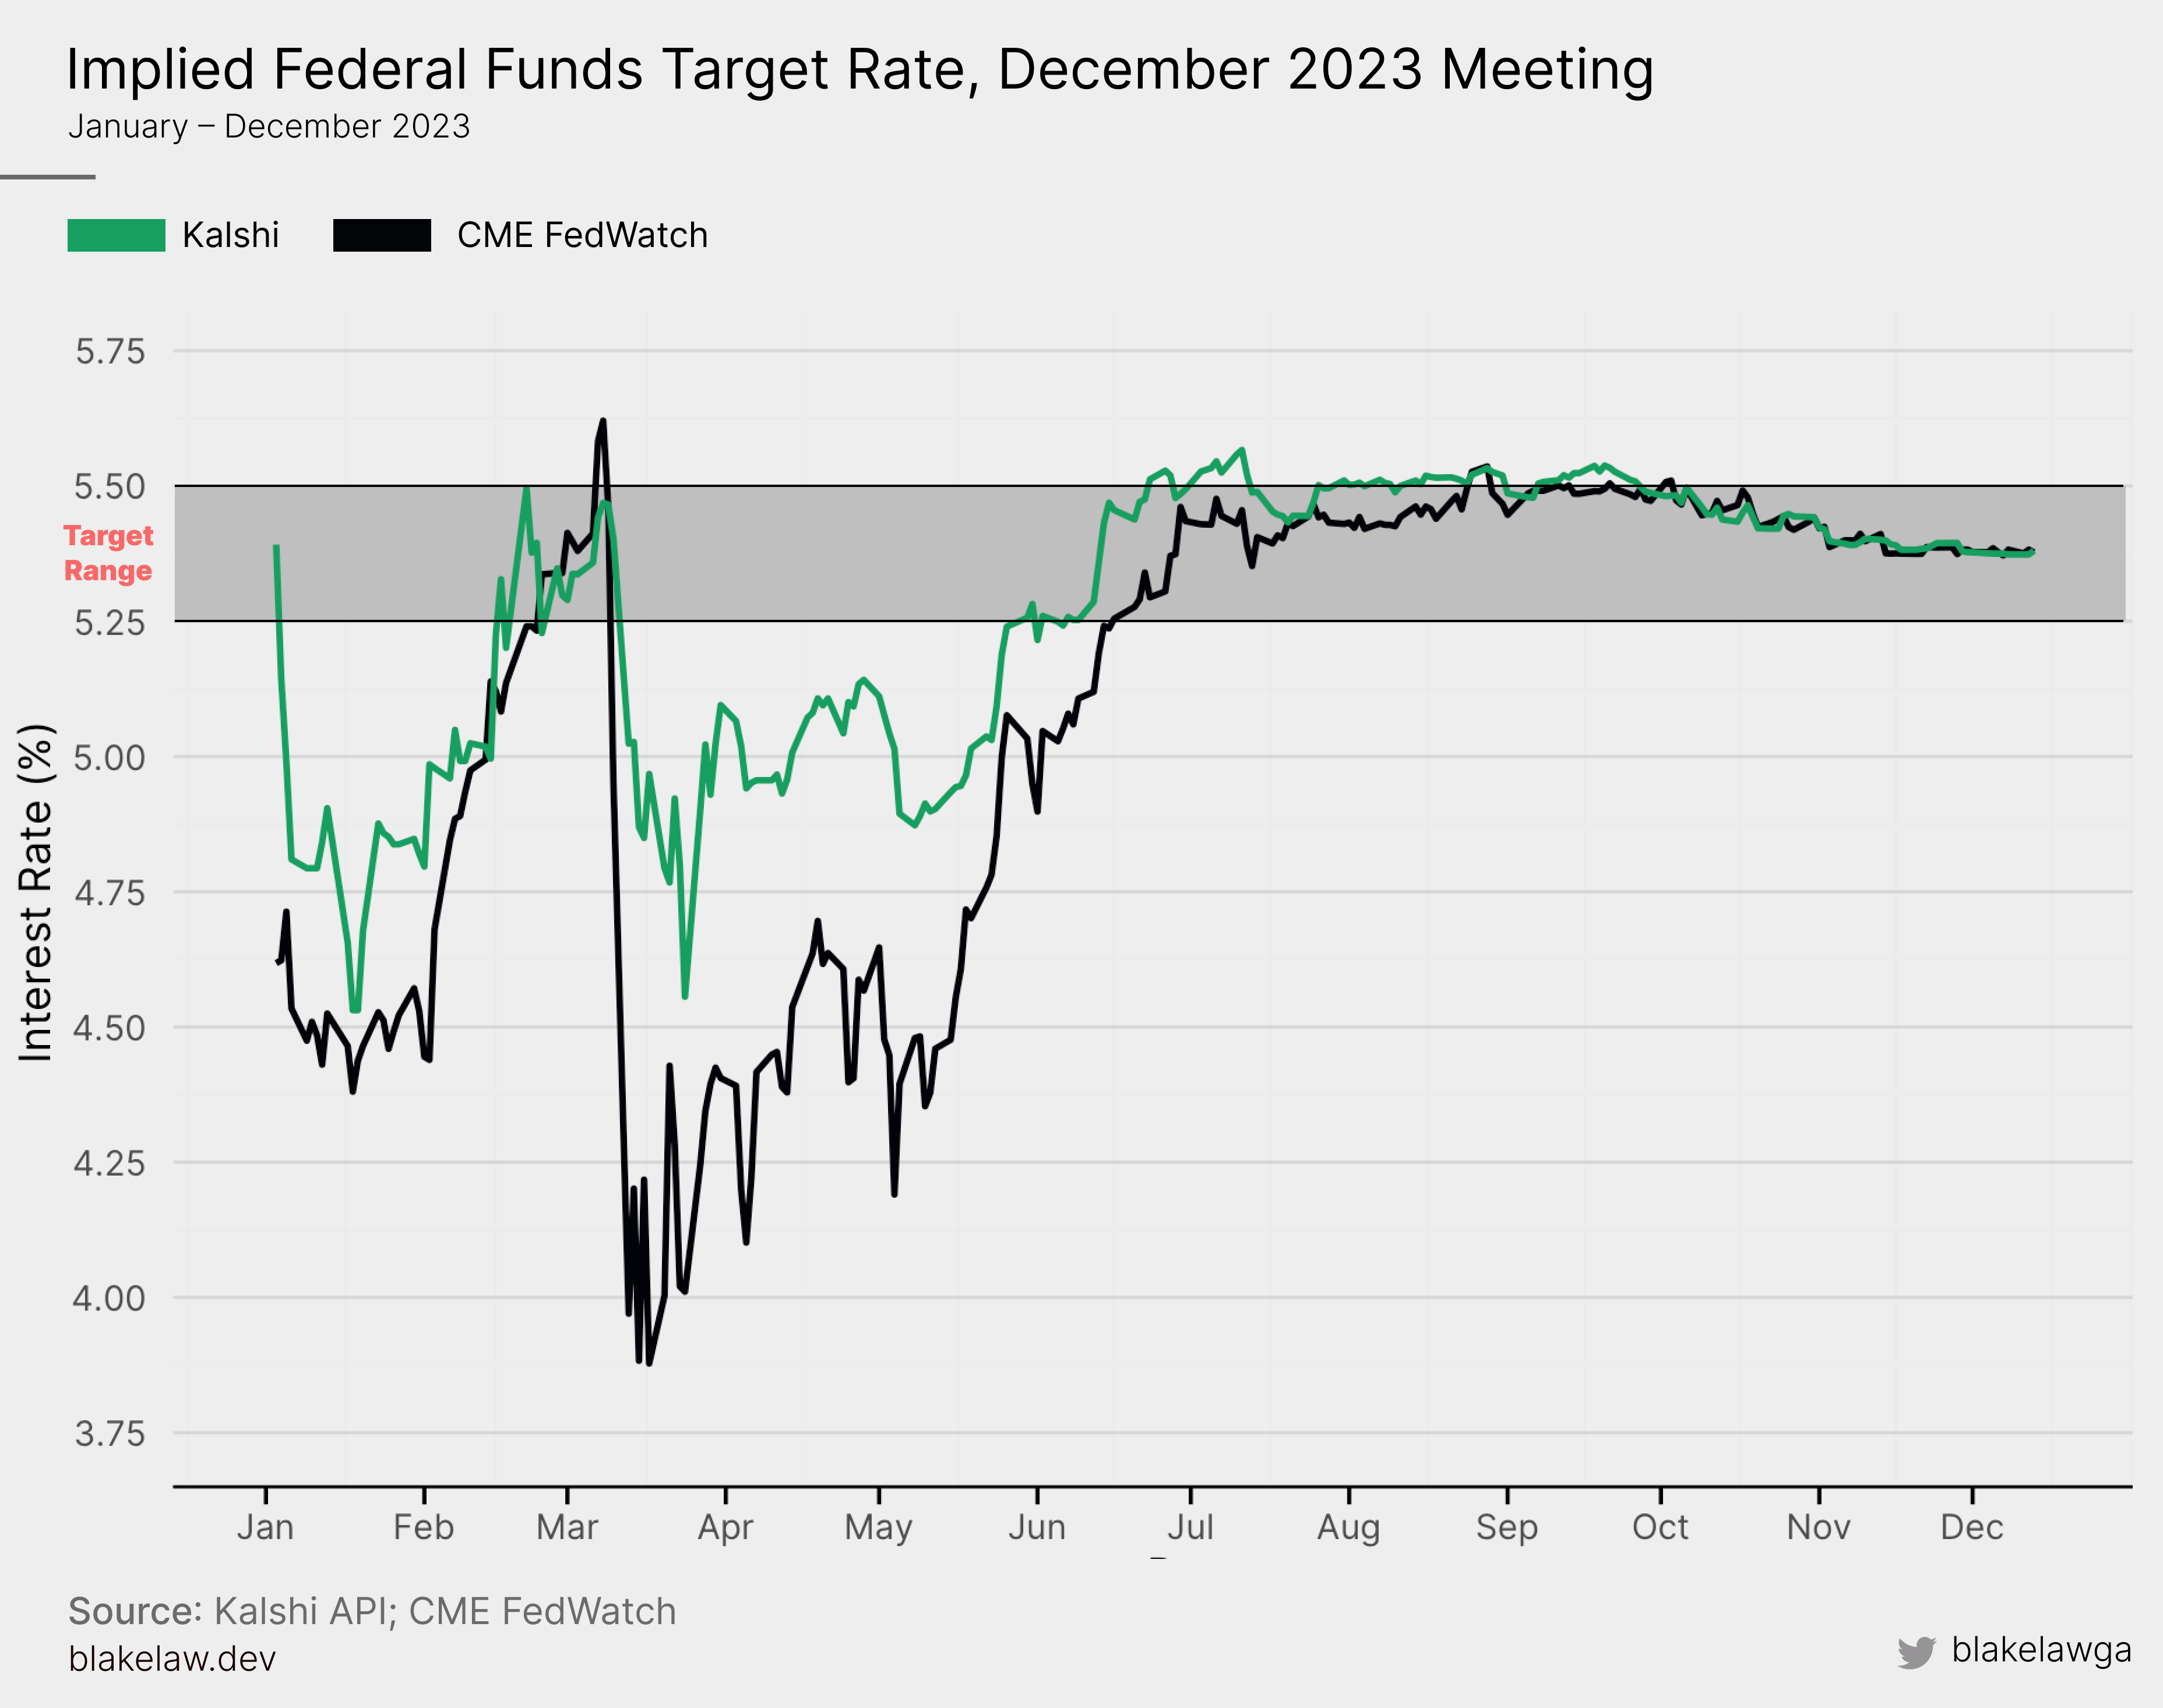
First, we can visually see something in common with all three charts: Kalshi and FedWatch were roughly in line for most of the year, except for a rather large divergence starting in mid March and continuing until near the end of May, when the FedWatch tool’s expectations dropped sharply, possibly due to signs the economy was cooling down, such as lower inflation.
Second, we can see that both markets were very confident that the target range for the September meeting would be \(5.25-5.50\%\) since June, while in November and December the markets were on the fence between a rate hike and no change up until around two months before the respective meetings, where they converged to the midpoint, \(5.375\%\).
Finally, we see slightly more noise in Kalshi’s data, due to lower trading volume and liquidity. This is clearest in the November meeting chart, where there are seemingly random, large fluctuations in January that aren’t explained by economic trends. However, the volume significantly picks up later in the year and becomes nearly as reliable as the FedWatch.
Measuring accuracy
How can we quantitatively measure which one is more accurate? Rather than use mean-squared error or some standard metric, I decided that the circumstances warrant a special metric, as the target is a range, not a point. So, for a given data point, the error will be scored as follows:
- If the point is within the final range, there is no error.
- If the point is outside the range, take the minimum distance to the boundary closest to it. For instance, \(5.75\) would correspond to an error of \(0.25\), while \(5.15\) would correspond to an error of \(0.10\).
Mathematically, this can be written as
\[\text{E}(x) = \begin{cases} 0 & \text{if } A \leq x \leq B \\ |x - A| & \text{if } x < A \\ |x - B| & \text{if } x > B \end{cases}\]With theoretical federal funds target rate being from $A$ to $B$.
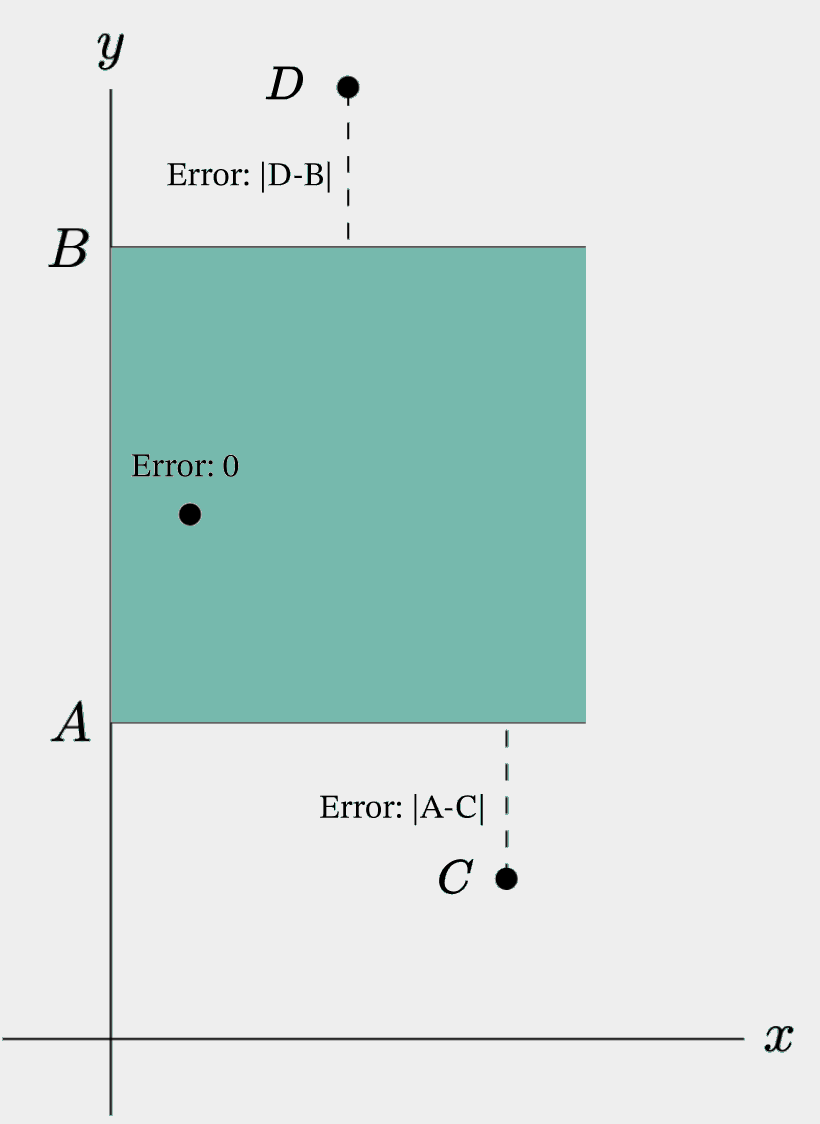
Sample error calculations
With that in mind, let’s calculate the average error for each meeting and market. Since prices may add up to over $1.00 on markets, we will divide by the sum of market prices, which themselves are derived by taking the midpoint of the ‘yes bid’ and ‘yes ask’ from the order book:
\[\begin{equation}E_{avg} = \frac{1}{N} \cdot \sum_{i=1}^{N} E\left(\frac{\sum_{j=1}^{K} M_{j} \cdot P_{i,j}}{\sum_{j=1}^{K} P_{i,j}}\right)\end{equation}\]where
- \(E(x)\) is the error function
- \(M_{j}\) is the midpoint of a given federal funds range $j$
- \(P_{i,j}\) is the market price, equal to \(\frac{a_{i,j}+b_{i,j}}{2}\)
- \(a_{i,j}\) is the yes ask price at time $i$ in range $j$
- \(b_{i,j}\) is the yes bid price at time $i$ in range $j$
- \(N\) is the total number of discrete times
- \(K\) is the total number of target ranges (for instance, in Dec. 2023 \(K = 15\))
Running this through each of the dataframes yields the following results:
In each of the three meetings, Kalshi is more accurate than FedWatch, including an impressive \(0.098\%\) average error for the September meeting, more than half of FedWatch’s.
Conclusion
Kalshi offers a more accurate picture of the federal funds rate over the three FOMC meetings analyzed, offering a \(0.13\%\) more accurate measure on average. In the future, I would like to look at more meetings to see if this pattern holds. Additional prediction markets, such as Polymarket, could be incorporated into the analysis to strengthen the assessment of whether retail prediction markets outperform the CME. These diverging results also beg the question: with an efficient market, why aren’t institutional investors mimicking the trades of Kalshi if they are more accurate, or vice versa?